Overview
Stat Arb V4.0 'Opulen' is the latest Statistical Arbitrage trading product developed by FX AlgoTrader. V4.0 'Opulen' uses a unique JavaFX interface to control the underlying system parameters deployed on each chart running stat arb tools in MetaTrader MT4.
Stat Arb V4.0 Opulen has been specifically architected to run on MetaTrader MT4 with fully automated order entry and exit based on a traders user defined statistical arbitrage strategies.
Request Product Data Sheet
V4.0 'Opulen' is made of up from three core components which are:-
FXA Stat Arb V4 JFX (An Expert Advisor) |
FXA STD Indicator V4 JFX (An Indicator) |
FXA_JFX_Interface.jar (The JavaFX control interface program) |
V4.0 'Opulen' builds on the success of Stat Arb V3.0 with the introduction of the following core differentiating features:-
Integration into the FX AlgoTrader Real Time Correlation Indicator† |
Synthetic Trading Option |
JavaFX Control Interface |
Optimized Reversion Targets |
Optimized Trend Detection |
Accross the board code optimization for the EA and indicator |
† The FX AlgoTrader Real-Time Correlation Indicator is an optional extra - it is not included in the base package.
V4.0 'Opulen' opens up a new range of statistical arbitrage trading strategies for financial market traders. V4.0 can be run in either a traditional Statistical Arbitrage/Pairs trading strategy or in a hybrid trend following market adaptive automated trading mode.
For an understand of the basic concepts involved in Statistical Arbitrage we would suggest you read the V3.0 Overview
Features in Detail
Real-Time Correlation Integration
Correlation analysis is the initial step in selecting optimium candidates for arbitrage trading. Ideally, suitable Instruments to trade should be highly positively correlated on higher timeframes. This means they should both be moving in step - so if one increases in value the other follows suit and vice versa.
Historically the trader would have to monitor the correlation of the selected pairs to ensure they contnued to be highly correlated on the higher timeframes.
With 4.0 'Opulen'the trader has an option to integrate the system with the FX AlgoTrader real time correlation indicator so that when the long term correlation of the pairs being traded falls below 80 or 0.8 the V4.0 'Opulen' arb system will no longer place automated trades.
This methodology ensures the arbitrage system stays out of highly divergent situations where the long term correlation has broken down.
As soon as the long term correlation is restored the system will then re-activate automatically and continue searching for the defined entry requirements based on the traders parameters.
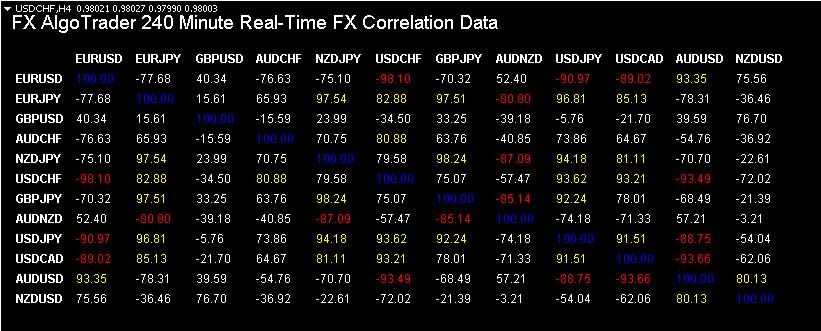
The screenshot above shows the real time correlation data for several forex pairs. We have tuned the indicator to replicate the 50 period correlation data published by mataf.net for verification purposes.
From the data above suitable arbitrage candidates would be as follows:-
| Arb | Synth Pair | Arb | Synth Pair |
|---|---|---|---|
| EURUSD / AUDUSD | EURAUD | EURJPY / NZDJPY | EURNZD |
| EURJPY / NZDJPY | EURNZD | EURJPY / USDCHF | |
| EURJPY / GBPJPY | EURGBP | EURJPY / USDJPY | EURUSD |
| EURJPY / USDCAD | NZDJPY / GBPJPY | GBPNZD | |
| NZDJPY / USDJPY | NZDUSD | NZDJPY / USDCAD | |
| USDCHF / USDJPY | CHFJPY | USDCHF / USDCAD | CADCHF |
| GBPJPY / USDJPY | GBPUSD | USDJPY / USDCAD | CADJPY |
| AUDUSD / NZDUSD | AUDNZD |
Where the two selected instruments for arb trading have a common component on each side eg 'USD' or 'JPY' the position created (by opening a long position and short position eg Long EURUSD / Short AUDUSD) effectively creates what we call 'a synthetic pair'.
We have architected V4.0 'Opulen' so that (where possible) only the synthetic pair is traded. This typically reduces the spread cost by 50% (as you are only trading one pair) which opens up more short term, higher frequency trading opportunities. This was not possible with our older statistical arbitrage products. We will discuss these in more detail in the 'Trend Following' section.
V4.0 'Opulen' can trade any quoted assets in the MetaTrader 4 environment so it is not restricted to forex pairs. If you want to run the system on indices or commodities you can.
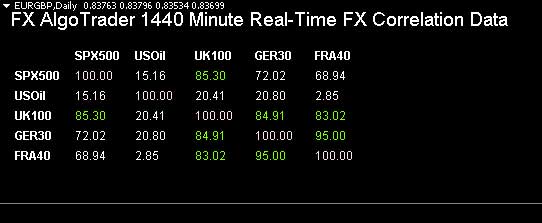
We have also improved the FX AlgoTrader real-time correlation indicator so that traders can input user defined assets.
So if you want to track the correlation of indices you can easily do so as shown below.
Trend Following - A worked example
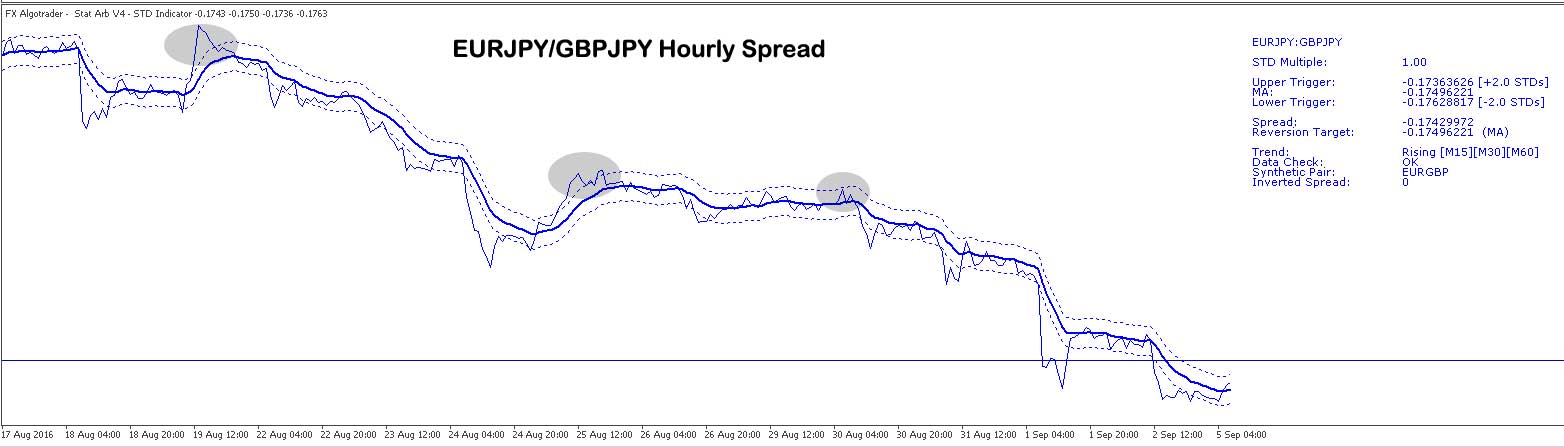
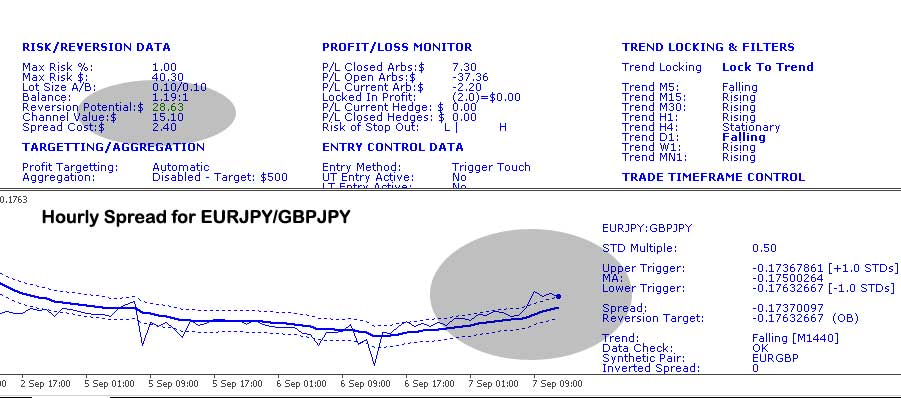
Currently (05/09/16) the most highly correlated forex pairs on the daily timeframe are EURJPY and GBPJPY with a correlation of 94.66. The screenshot below shows the spread for EURJPY and GBPJPY.
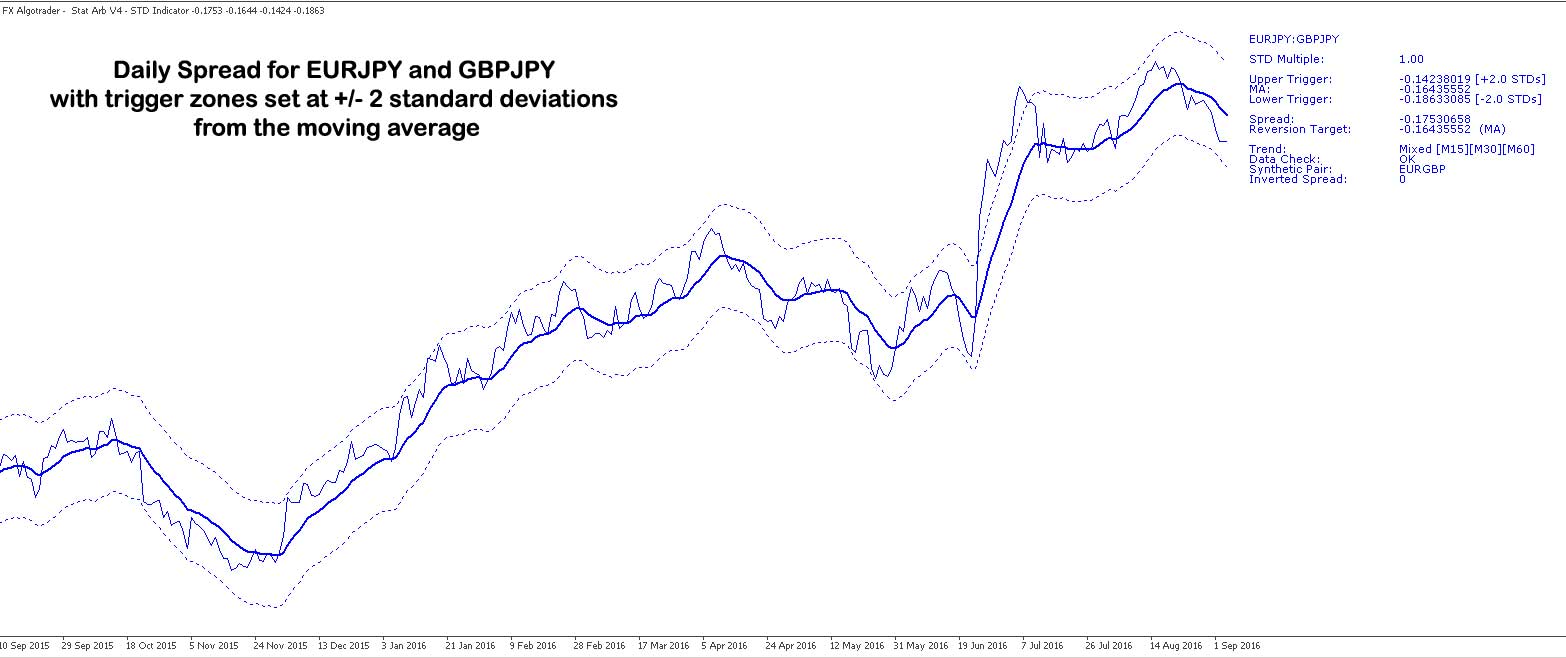
The spread for EURJPY and GBPJPY shows a long term upward trend. The synthetic pair or position created by simultaneously trading EURJPY and GBPJPY (in opposite directions ie Long EURJPY/Short GBPJPY or vice versa ) is EURGBP.
Note the virtually perfect symmetry between the spread of EURJPY/GBPJPY and the Daily EURGBP chart below.....
.jpg)
Also of particular note on the daily spread for EURJPY and GBPJPY is the relatively infrequent penetration of the trigger zones.
Cleary the number of arb entry opportunities on the higher timeframes using 2 standard deviations as our trigger zone are few and far between which may leave all but the most patient traders somewhat frustrated by the lack of trading opportunuites.
If we could trade 'trends within trends' and but also stay on the right side of the major trends this may provide higher frequency trading opportunities.
This is exactly what the trader can do with the V4.0 'Opulen' arbitrage system. Let's examine the EURJPY/GBPJPY spread on the lower timeframes to see how we can use V4.0 'Opulen' to automatically detect a 'trend within a trend'.
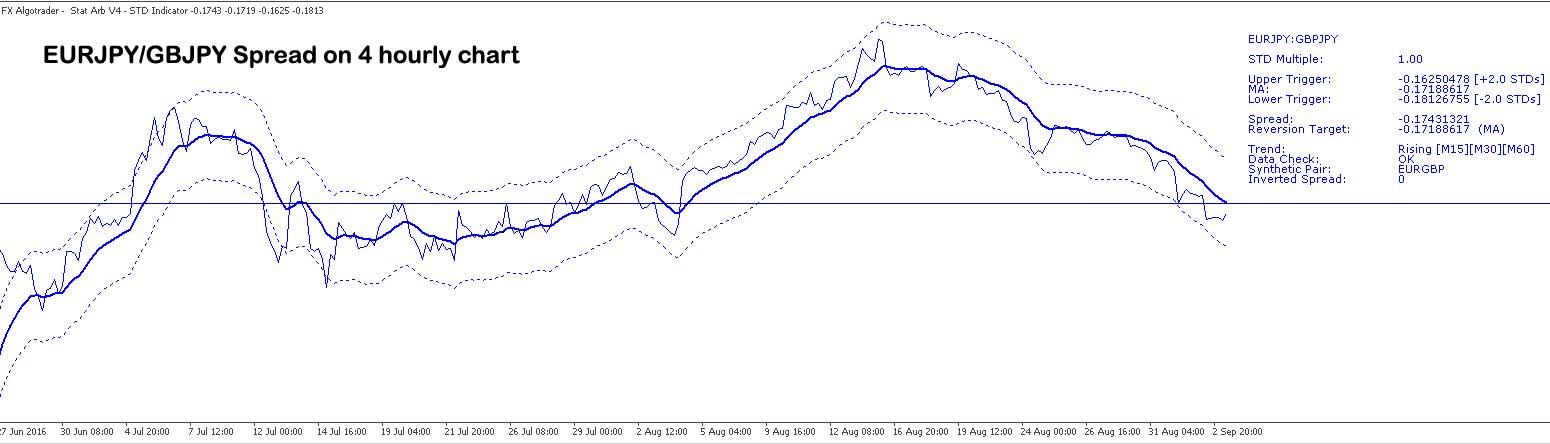
The screenshot above shows the 4 hourly EURJPY/GBPJPY spread. We can see the spread has been falling since around the 19th August 2016 which therefore means the EURGBP rate is in a short term downtrend.
Note the relatively small number of times the spread has touched the trigger channels. So the 4 hourly timeframe would not have provided many, if any, entry opportunities. Moving down to the hourly chart.....
Here we can see the spread breaks through the upper and lower trigger channels more frequently thus creating potential entry opportunities for the system. Moving down to the M30 chart.....
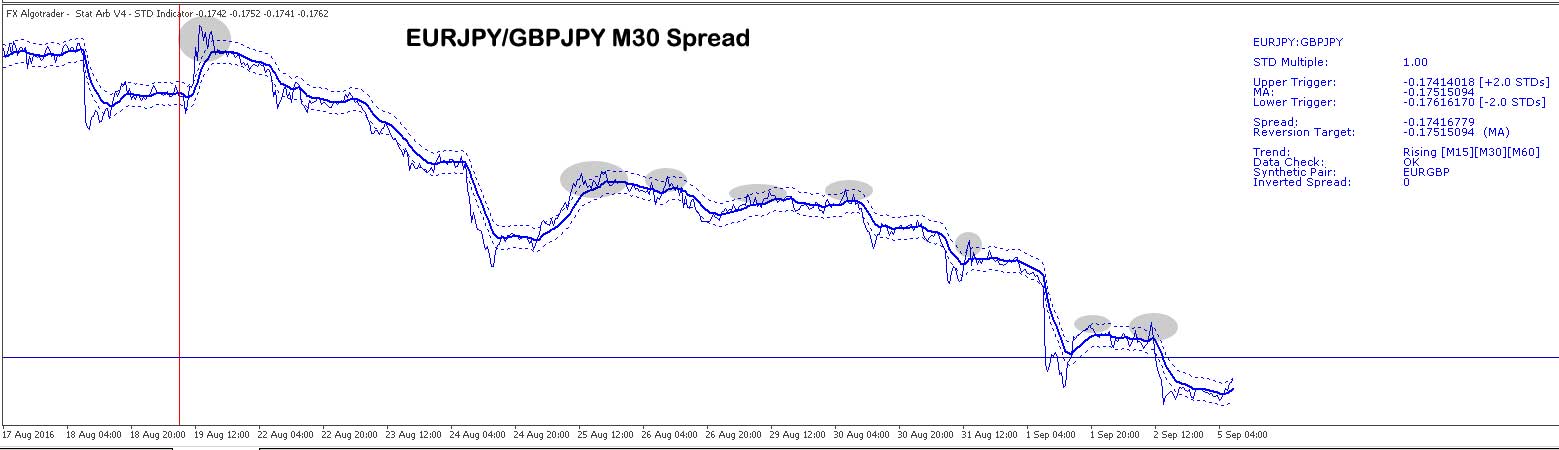
On the M30 timeframe we can see significantly more areas where the spread breaks through the trigger channels. As the timeframe reduces so does the potential reversion potential offered by the trade.
V4.0 'Opulen' automatically calculates the channel value on the specific timeframes. In the table below we can see how the profit potential changes proportionally with the trading timeframe.
| Trading Timeframe | Reversion Data | Potential Profit from Trigger Channel to Mean (A Mean Reversion Trade) |
|---|---|---|
| Daily | 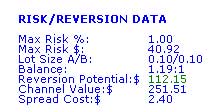 |
251.51 (Channel Value) - 2.40 (Spread Cost) = $249.12 |
| 4 Hourly | 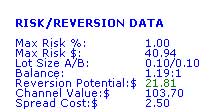 |
103.70 (Channel Value) - 2.5 (Spread Cost) = $101.20 |
| Hourly | 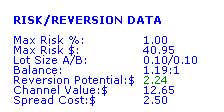 |
12.65 (Channel Value) - 2.5 (Spread Cost) = $10.15 |
An example trade based on this analysis.
V4.0 'Opulen' calculates the trend of the moving average of the spread on all chart timeframes above and including M5. We know that the long term trend for EURGBP is up but we also note the trend since the 19 August 2016 has been down.
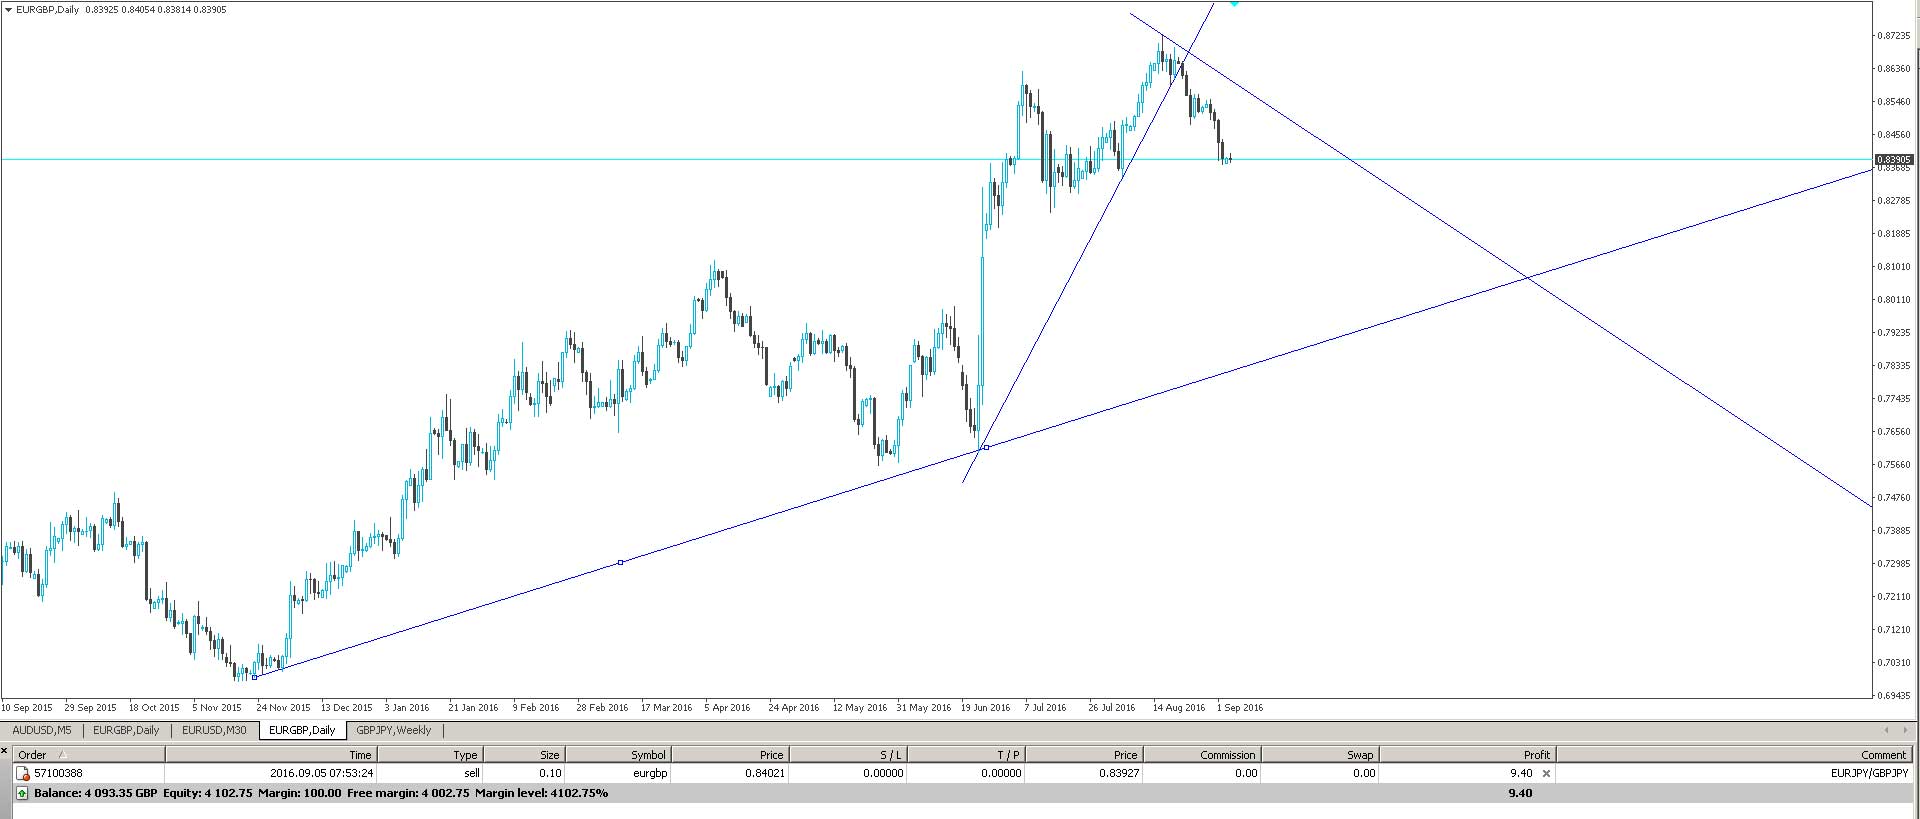
Drawing some basic trendlines on the EURGBP MetaTrader chart shows how the long term trendline is still intact from November 2015... but the upswing since around June 2016 was broken at the beginning of August 2016.
From a purely technical perspective we would expect to see the EURGBP go down to test the long term trendline and also be bounded by the short term downtrend which should act as technical resistance.
On further inspection of the V4.0 'Opulen' trend data we see the following:-
V4.0 'Opulen' atomatically performs real time analysis of the moving average of the spread on each timeframe. If the moving average of the last three MetaTrader chart periods is rising the system deems the trend to be rising, correspondingly, if the moving average of the spread is falling - the system will deduce the trend is falling.
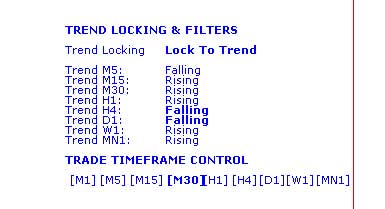
For this example we note the 4 hourly and Daily trends are falling but the lower timeframes M15, M30 and H1 are rising. If we look at the M30 MetaTrader chart below we can see the channel value is around $11.69 based on a position size of 0.1 lots.
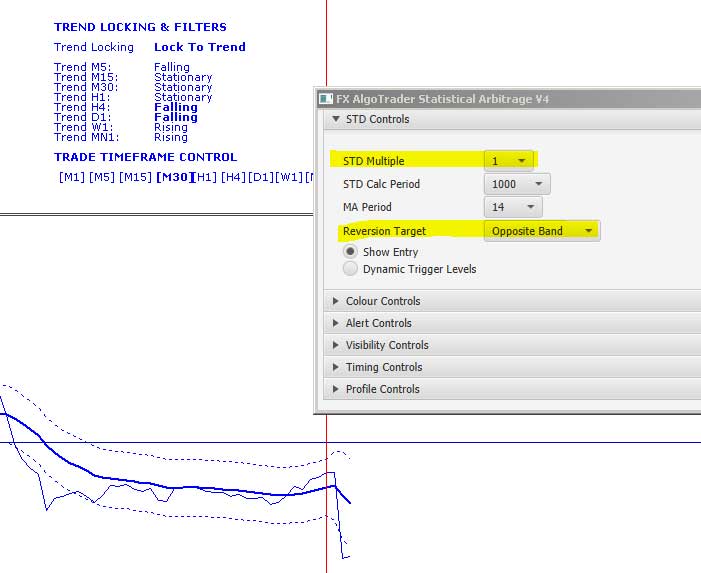
In view of this we set the system up to trade on the M30 MetaTrader chart (note [M30] is in bold in the Trade Timeframe Control data) and the system was set to trend follow on the H4 and D1 timeframes (Note: 'Falling' is in bold for both 'Trend H4' and 'Trend H1' in the 'Trend Locking & Filters' data display.
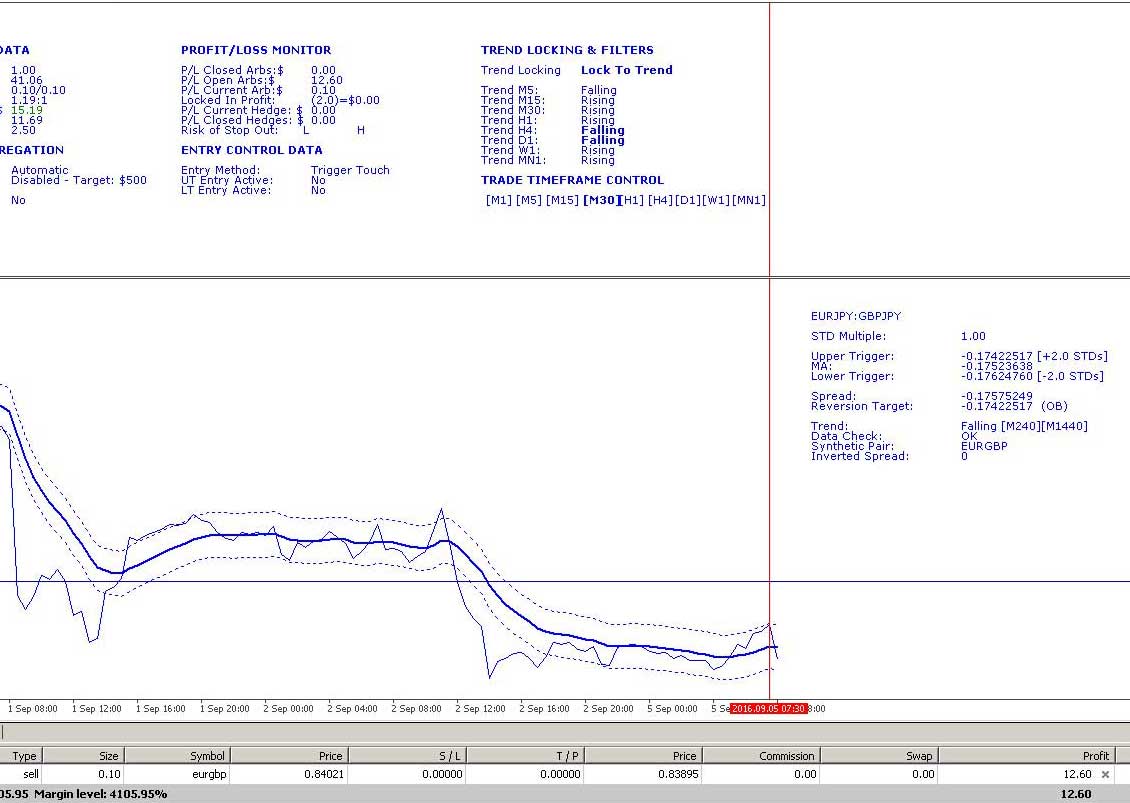
The system automatically executed a short EURGBP trade at 07:53 on 05/09/2016 which is shown by the vertical line in the above MetaTrader chart.
We saw the spread diverge from the mean and touch the upper trigger channel which satisifes the entry conditions in a falling trend (defined by our trend locking parameters, as we've set the system to lock to the H4 and D1 trend which are both falling).
I set a manual profit target of $40 USD which was approximately twice the band width... the reason I did this is because in trending spread environments the spread will almost certainly revert back to the mean (moving average of the spread) and then continue through to the opposite band.
You will often then see the spread 'walk the opposite band' for some time which is very similar to how price behaves with Bollinger Bands which are also volatility based indicators.
This example auto trade was closed by the system as shown below for a $40 USD profit. Our maximum risk was set at 1% of account equity which in this case was $41.33. So more or less a 1:1 risk reward ratio.

For the more patient trader, the reversion targets can be changed after the trade has been opened. To do this is exceptionally easy, you simply increase the STD mutliple in the Java interface and either use a manual profit target or alternatively let the system close the trade automatically by setting the reversion target to 'Opposite Band'. You can see these parameters in the screenshot of the interface below.
Reversion Based Trading on Indices
Indices tend to have more consistent correlations than forex and the long terms spreads are also much more stationary in nature. These features make indices of great interest to arbitrage traders looking to execute mean reversion trading techniques.
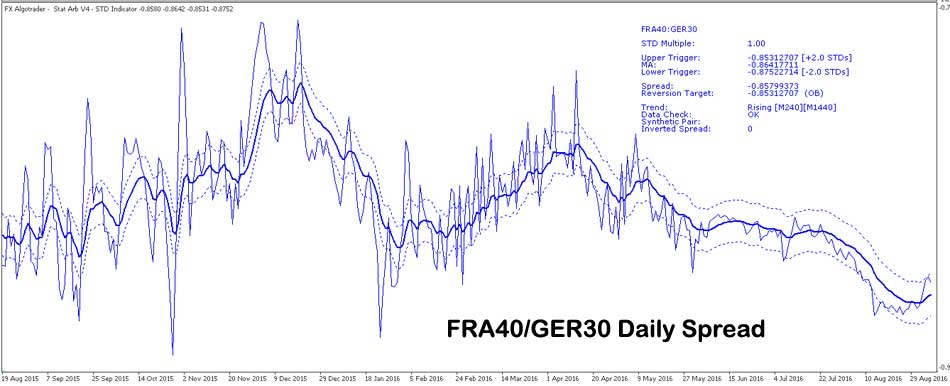
Let's examine the spreads of some highly correlated indices starting with the German DAX (GER30) and French CAC 40 (FRA40). At the time of writing the daily correlation between GER30/FRA40 is 0.95 meaning they are 95% correlation and moving together very closely.
In the screenshot below of the Daily FRA40/GER30 spread we can see some excellent examples of mean reversion where the spread diverges quite significantly from it's moving average and snaps back to it quite abruptly.
These are excellent arb opportunities for traders who are patient and are able to trade on the longer timeframes. Nonetheless, there are also numerous opportunities to trade shorter timeframes and align the traders in the direction of the longer term trend.
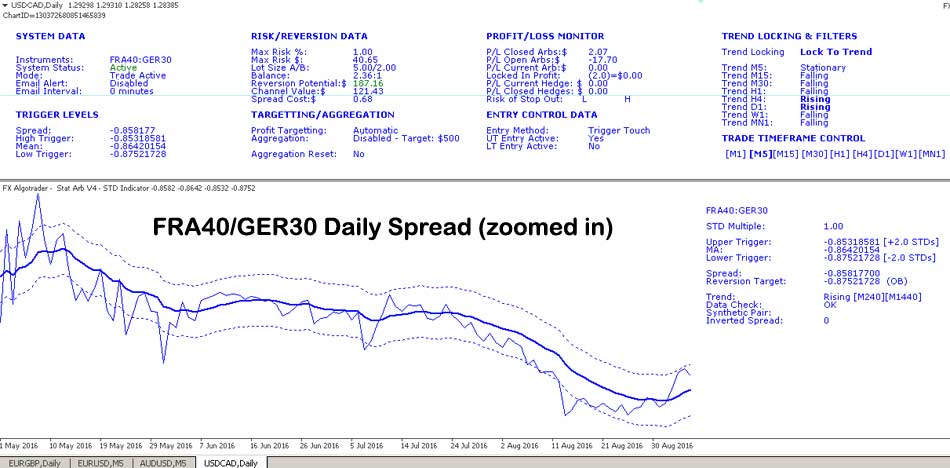
Zooming into the Daily spread is illumintating as we can see the trend of the FRA40/GER30 spread is down over the last few weeks.
The trend filters in V4.0 'Opulen' show the trend Rising on the H4 and D1 timeframes but falling on all others apart from M5 which is stationary. If we drill into the lower timeframes a little more....
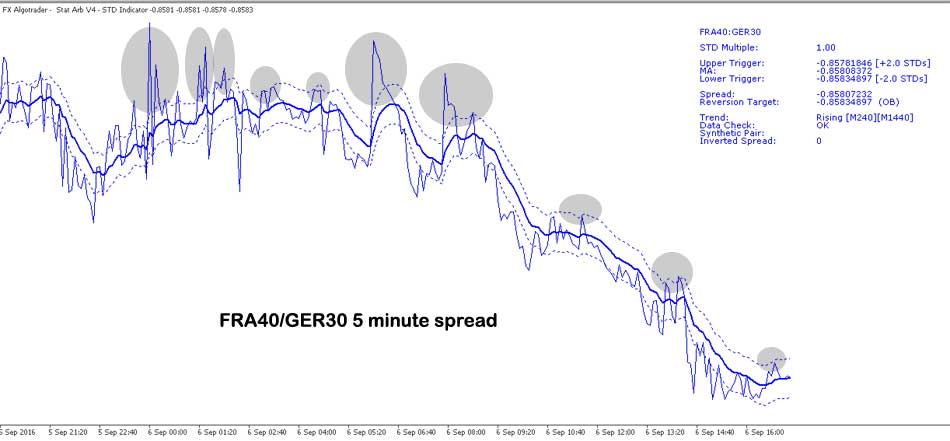
The 5 minute MetaTrader chart of the FRA40/GER30 spread confirms the downtrend and also shows numerous potential entry points for arb trades alligned in the direction of the downtrending spread.
The objective in a downtrend is to take entries from the upper trigger band which would be Short FRA40 Long GER30. So V4.0 'Opulen' aims to enter the market at opportune moments where the FRA40 has momentarily rallied against the GER30 in the overall downtrend...
in essence we are selling rallies in the FRA40 and buying GER30 as a hedge on the basis that the overall trend will resume, the spread will revert to the mean and pass throught it to the lower trigger channel and beyond.
In trending spreads on shorter timeframes the trader can extract significant value from the trade by extending the exit levels after the initial trade has been opened.
This can easily be achieved by simply increasing the STD Multiple or by setting a defined profit target in the JavaFX interface.
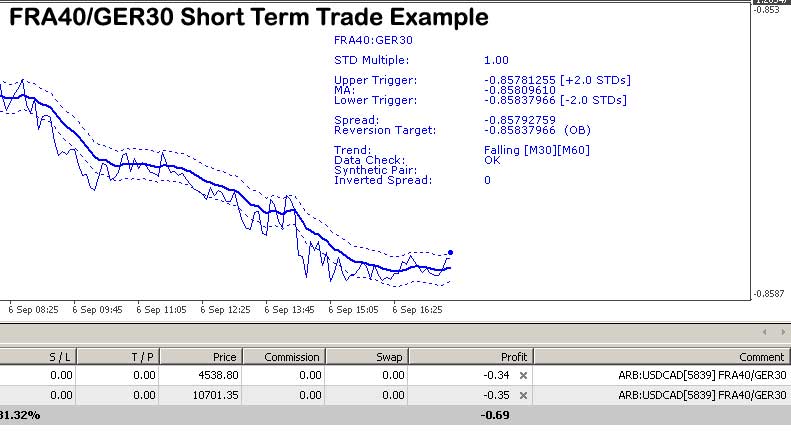
The screnshot above shows a short FRA40 Long GER30 trade triggered when the spread touched the Upper Trigger Level. I set the reversion target as the opposite band which would theoretically deliver a about $6 USD profit based after subtracting spread costs of $0.68. However, as the spread is downtrending I decided to increase the STD Multiple from 1 to 3.0.
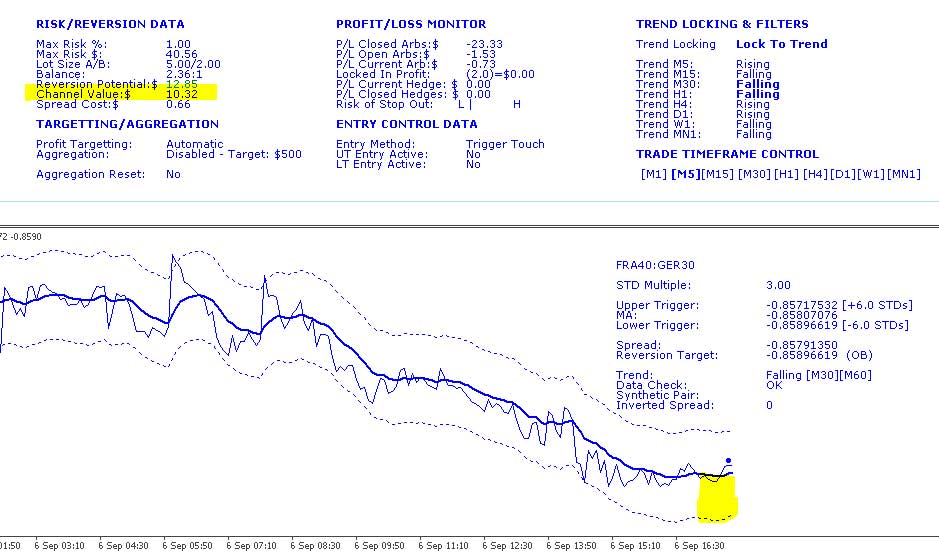
By increasing the STD Multiple to 3.0 we see the trigger bands have moved further away from the moving average of the spread. This in turn has increased the channel value to approximately $11 USD.
You will note that our entry point is slightly above the moving average which will give us a slightly higher potential profit if the spread hits the lower trigger channel which is also the arb exit point.
It is very important to be aware that the trigger levels change based on volatility (much the same an Bollinger Bands).. so in volatile markets the trigger levels may broaden whereas in less volatile market conditions the trigger levels may narrow and move closer to the moving average of the spread.
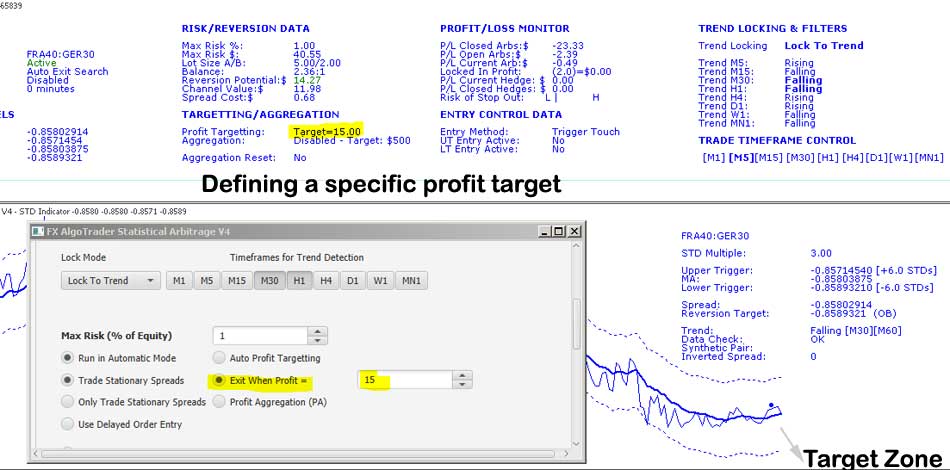
Therefore we may decide to use a defined profit target which was can easily set in the interface. If the arb trade is left overnight the spreads may narrow considerably and our potential profit could be less than anticipated. So in this case we will set a defined profit target of $15.
Adapting to changing conditions.
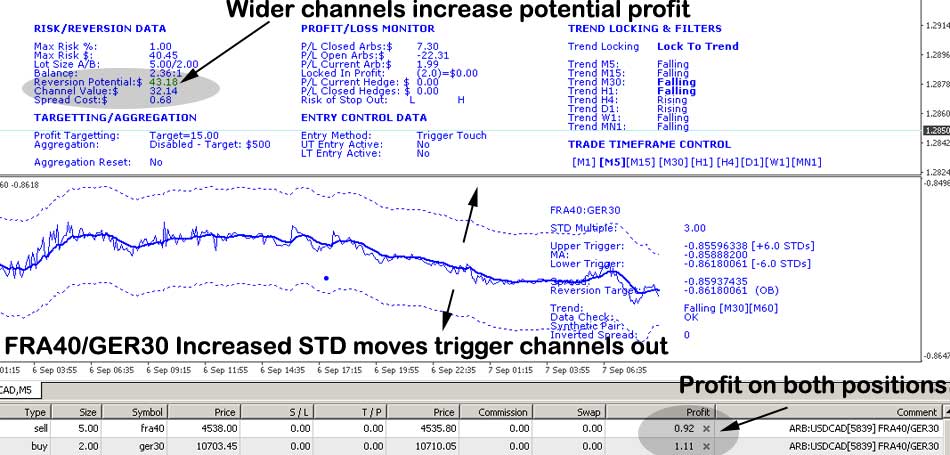
I left FRA40/GER30 position over night - today we can see standard deviation of the spread has increased which pushes out the trigger channels. Our effective position didn't do a great deal overnight as the spread stayed in a very stationary mode with small oscillations around the mean.
The upside of an increase in standard deviation is your trigger channels will be further away from the moving average of the spread. This effectively increases the potential profit for the arb on the basis the trigger levels are hit (for both entry and exit). The downside is the more remote the trigger level from the mean, the harder it will be to reach - ie the number of times the spread will test these limits will be lower in frequency.
We can see from the screenshot below the current channel value using 3.0 as our STD Multiple is $34 USD. Earlier on this morning when the standard deviation was higher the channel value was even higher at over $80 USD. The good news is our current P&L for the arb position is just in profit even though we haven't really seen the spread resume its downward trend so far today.
As we're using a defined profit target of $15 USD it doesn't really matter what STD Multiple we use on the MetaTrader charts as V4.0 'Opulen' will exit the arb position automatically as soon as the overall arb profit is greater or equal to our defined profit targetof $15 USD.
On the other hand if V4.0 'Opulen' is using 'Auto Profit Targetting' the system will look to exit when the spread has touched the reversion target AND the overall arb position is in profit.
If 'Auto Profit Targetting' was being used in this scenario it would be adviseable to reduce the STD multiple so that the trigger bands narrowed - this would increase the probability of the exit level being touched by the spread.
Multi-Timeframe Arbing, phased entries and exits
V4.0 'Opulen' is quite different from all the previous Stat Arb versions as it can trade the same assets from different MetaTrader charts. Essentially the trader can duplicate the same positions using multiple arbs running on different MetaTrader charts.
In Stat Arb V3.0 it was not possible to duplicate arbs at all. With V4.0 'Opulen' you can have as many duplicate arbs as you like - they can run from any MT4 chart. This creates obvious opportunities for phased entries.
In the screenshot below we can see two short EURGBP synthetic trades which are both slightly out of the money. The trades were executed from different MetaTrader charts. We can tell this by looking at the order comment in the MT4 terminal window.
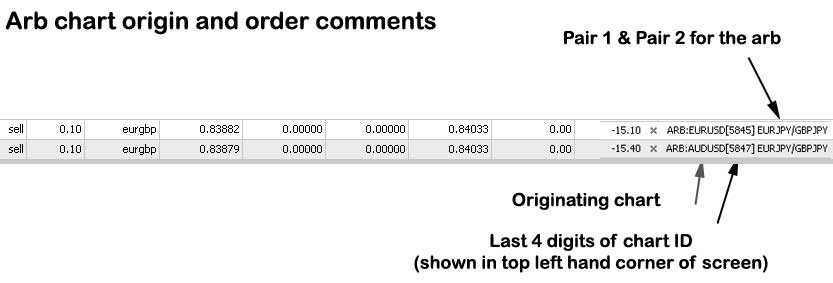
In the screenshot above we can see the system has opened two Short (sell) EURGBP trades. Once opened from the EURUSD MetaTrader chart with Chart ID ending 5845 (in square brackets) and the second order was executed from an AUDUSD MetaTrader chart with Chart ID ending 5847. In both cases the arbs were set up using EURJPY and GBPJPY which creates a synthetic EURGBP trade.
Both of these arbs were executed off a 5 minute MetaTrader chart. As you can see the spread doesn't do what we want/expect the whole time so having the option to set up multiple entry points into the same position, by running the same arb on a different MetaTrader chart with different parameters, gives the trader additional tools to play with when things don't go to plan. So in this case we could set up the same arb on a higher timeframe on a different MetaTrader chart which would act as an 'averaging down trade'.
The screenshot below illustrates this. V4.0 'Opulen' opened a third trade on the EURGBP hourly chart when the spread hit the upper trigger channel. Depending on the traders attitude towards risk as the timeframe increaes you could of course increase the position size which would bring your overall position back into profit more quickly IF the spread moved towards the intended zone.. if it doesn't then the probability of being stopped out by the V4.0 'Opulen' global risk controller increases.
These are the challenges which all traders have to come to terms with. If the trader choses to average down/ compound their positions they have to appreciate they are increasing leverage which unless controlled carefully can destroy trading accounts... hence the 95% failure statistics in retail forex... people just doesn't get leverage and what it does to an account.
Request Product Data Sheet
Pricing
Please read the Installation Guide and License Agreement before purchasing
IMPORTANT: This product is developed for arb traders with existing arbitrage strategies - it will not make a loss making trader profitable
 |
$499.95 USD
One Time Fee with web based Technical Support
(no ongoing charges) |
System Performance
We often receive requests about the performance potential arb traders can expect from the V4.0 'Opulen' system. Unfortunately there isn't a definite answer to this question as V4.0 is a toolset designed to automate the traders arbitrage strategy. Therefore the success or failure of V4.0 is totally dependent on how its deployed and the parameters and timeframes it is run on. Probably the best analogy is to think of V4.0 as a high performance car which in the right hands is capable of producing solid performance but conversely, in the wrong hands, won't produce a good return or in simple terms, 'rubbish in equals rubbish out'
The retail trading space is made up of winners and losers where the losers represent the majority of market participants. There is a widely used industry statistic which states 95% of market participants lose their stake or account equity over time and the remaining 5% make consistent profits. The tools we market won't necessarily move participants from the 95% loser camp into the 5% winning camp so participants searching for the all elusive system which makes money without requiring any effort or skill will always be disappointed. Such systems simply don't exist in the retail space.
Furthermore, traders need to be aware that certain EA vendors publish highly optimised, curve fitted systems (based on sample data) which produce amazing equity curves when backtested but in reality, never manage to replicate their historical backtested performance when run live or in a forward test environment. This is because the markets are constantly changing so using a system optimised for specific historical market patterns will pretty much always dissapoint in the long term unless the strategy is adapted. So please be wary of vendors who claim their EAs can produce X% returns.
RISK DISCLOSURE
The products on this site are trading tools and are not intended to replace individual research or licensed investment advice. Past performance does not guarantee future results. Trading currencies, indices or commodities involves substantial risk, and there is always the potential for loss. No representation is being made that these products will guarantee profits or not result in losses from trading. Any explanation or demonstration of the product's operation should not be construed as a trade recommendation or the provision of investment advice. The purchase or sale of a currency can only be performed by a licensed Broker/Dealer.